Month of the Green Wood Dragon Jia Chen 甲⾠ The Guardian April 2022 and the Geography of Time
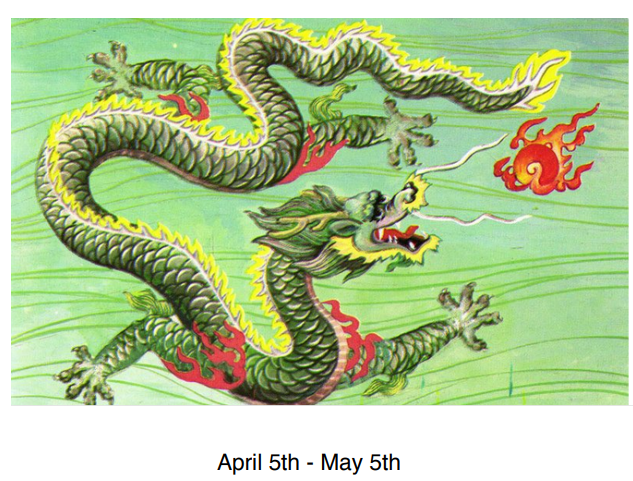
This year, April is ruled by the Yang Green Wood Dragon. The Green Wood Dragon represents tall, ancient, stable, and noble trees growing on a mountain top. This allows him to clearly see how we should navigate the current situation on earth for the benefit of all. Unfortunately, he also embodies energies that are a proud, strong, and stubborn and these are not favorable qualities for negotiation! Hopefully, those in power can rise above these personal traits and utilize the valuable, higher insights the dragon offers this month.
Over the last couple of pandemic years, I was struck by how time seemed to flow so differently. Just about everyone I talked to said that they found time passing very strangely because there was so much “sameness” in being stuck at home so much of the time. Some felt time had sped up and others that it had slowed down. I think people’s perception of time depended on where they lived.
All this talk about pandemic time, reminded me of a fascinating book I read a few years ago, “The Geography of Time,” by Robert Levine. I decided to revisit the amazing data he had assembled over 11 years of research, visiting 31 different cities in 10 different countries to record the flow of time.
We’re so used to equating geographical locations with space that we overlook the possibility that time is also geographical. In Classical Feng Shui, both space (the magnetic direction a structure faces) and time (the year the building was built) are used to determine the energetic blueprint of a structure. Both space-time and time-space, the visible and invisible aspects are brought together to determine the energetic dynamics of a structure, city or country. Each is considered a living organism with its own personality.
In his book, Robert Levine, explores the ways different cultures perceive time and how that perception correlates to a variety of different facets of the society. He discovered that cultures perceive time either through events or through clocks. Those cultures that went by event time tended to have a slower tempo of life and lived near or below the equator to the South. They also lived more in present time that cultures to the north.
Levine’s researchers measured the signature tempo of 31 different sized cities in 20 different countries They timed how long it took people to walk 60 feet and how long it took postal clerks to sell a stamp and make change. They also recorded clock accuracy in each of the cities. They then took their research and compared the numbers to a wide variety of statistical measurements to learn what effect the tempo of a place has on the lives of the people who live there. This was a eleven year study and the results were fascinating!
The 10 countries with the overall fasted pace of life were Switzerland, Ireland, Germany, Japan. Italy. England, Sweden, Austria, The Netherlands, and Hong Kong. The 10 countries with the slowest pace of life were Mexico, Indonesia, Brazil, El Salvador, Syria, Jordan, Romania, Bulgaria, China, and Kenya. The United States came in right the middle
between the two categories. Eight of the ten fastest countries were from Western Europe with Japan and Hong Kong being the only intruders! The amazing thing is that if he went back to measure a city, he would get the same tempo.
Cities of one country also differed greatly. Even though most of the people spoke the same language, there were significant differences in the pace of life. To study the United States, Levine divided it into four areas – Northeast, Midwest, South and West. In each of these areas, he chose three large metropolitan cities., three medium size cities and three smaller cities. The United States was measured differently and more extensively that the other countries.
In the United States, he measured the pace of walking, the time it took clerks to give change, the number of people wearing wristwatches, and the talking speed. Utilizing these measurements, he found the five cities with the fastest pace of life to be Boston, Buffalo, New York City, Salt Lake City and Columbus, Ohio. The five slowest cities were Los Angeles, Sacramento, Shreveport, LA, San Jose and Memphis. Since the book was written in 1997, wristwatches were being worn to tell time – now they are worn just for fashion. With the worldwide use of cell phones, that part of the data will need to be updated!
The Northeast was the speediest. They generally walked faster, gave change faster and wore more wristwatches. California cities had the slowest pace of all which was due mostly to slow walkers and bank tellers. Los Angeles’s score was based on the overall pace of life. They did, however, come in 13th in the number of people wearing wristwatches – definitely a fashion statement, even 25 year ago.
The book also measured other parameters of life in the United States. Two, I found really interesting, measured people’s charitable contributions (through United Way) and their willingness to help a stranger in need. What is amazing is that the 11 California cities (who measured the slowest in the pace of life measurements) were the “least” generous and helpful to others.
This amazing research really highlights how much we are affected by the invisible energies that shape our life experiences. Every location on Earth has an unique geography of time – a tempo that is reflected in those who live there and it can actually be measured! Where you lived does make a difference in your life. During the pandemic, this flow was artificially interrupted and made most of us more aware of how connected we are to the flow of time. I think event time and clock time probably also got confused – muddled. The ancient Feng Shui Masters knew what they were talking about!”


